Engineering review

Production performance
Desktop + mobile

Production,
under pressure.

Investigate delayed mobile content, startup layout shifts, and the slower path from room entry to usable controls and video.

Close or press Escape to begin.

Investigation overview

Delivery · Stability · Readiness

Conceptual overview, not measured geometry.
Chaturbate / Experience researchProduction performance review
04 September 2026

Desktop + mobile / An evidence-led white paper

Production,
under pressure.

Fast first paint, but a 9.24-second median mobile LCP. Where delivery, layout stability and room startup break down—and what to investigate.

Target: production · pft_EvlvMd=1Accepted session · Chrome · Desktop + mobile

The decision in brief

Slow catalog delivery, unstable desktop layout and the mobile room-entry tail are the priorities. Investigate the startup delivery chain, reserve the space that moves, and trace control and video readiness separately. The measurements identify symptoms and likely investigation paths—not a framework or package as the cause.

Measured concern01 / DELIVERY

Make the catalog arrive sooner.

Median mobile LCP is 9.24 s. In the representative run, 8.63 s elapses after the document response begins and before the LCP image request starts.

Investigate the parser-initiated script delivery chain and earlier content discovery.
Measured concern02 / STABILITY

Hold the page still.

Desktop’s median retained top-document shift score is 0.72. Repeated sidebar, body and grid movement makes layout reservation an immediate priority.

Moved elements are evidence of impact, not proof of the triggering code.
Measured concern03 / ROOM ENTRY

Protect the slower journey.

Mobile’s first source-qualified frame has a 1.78 s median and a 3.48 s maximum. Controls and video follow different clocks.

Keep the valid slow run. Measure control readiness and media startup independently.

Five observations per device and journey; descriptive medians unless otherwise stated. Measurements and per-run evidence.

Reading key
  • Evidence
  • Measured concern
  • Boundary
  • Hypothesis
  • Proposed test

Shapes and words identify a passage’s role—not a performance grade or confidence score. Select a dashed term for a short definition.

01 / Initial page load

The first useful page.

First paint comes early. The mobile catalog arrives much later. Desktop paints quickly, then moves substantially. These are different problems with different likely owners.

BoundaryCache-disabled, accepted-session reloads. Five runs per profile. Mobile is a desktop Chrome emulation, not a physical-phone benchmark. Profile controls filter metrics and tables; the narrative remains comparative.

Largest contentful paint
Desktop1.02 s
Mobile 4G9.24 s
Median · n=5 per profile
Layout-shift score
Desktop0.720
Mobile 4G0.178
Retained top-document session · ~30 s
Completed HTTP bytes
Desktop5.76 MiB
Mobile 4G4.90 MiB
Encoded completion bytes · ~30 s

The mobile wait is concentrated before the image request.

The LCP image is matched to its resource timing in every run. In the median-LCP mobile recording, the image starts at 8.80 s and LCP occurs at 9.24 s. Its observed resource span is 0.42 s; the final interval to paint is just 0.02 s.

Start the investigation upstream: what prevents useful catalog content and its image from being requested sooner?

EvidenceWhere the time goes
One representative run per profile · common 0–10 second scale. Phase colors apply only to this chart.
Desktop1.02 s
Mobile 4G9.24 s
Exact interval values supporting the bars
ProfileDocument responseBefore resource startResource spanAfter resource end
Desktop177 ms766 ms30 ms42 ms
Mobile 4G169 ms8,630 ms417 ms23 ms

Representative median-LCP runs, not a sum of independently calculated medians: desktop 05 and mobile 04. Cross-origin timing restrictions mean “resource span” includes waiting and loading; “pre-resource” is not pure discovery delay. Google’s LCP interval guidance.

Illustrated reading note / delivery
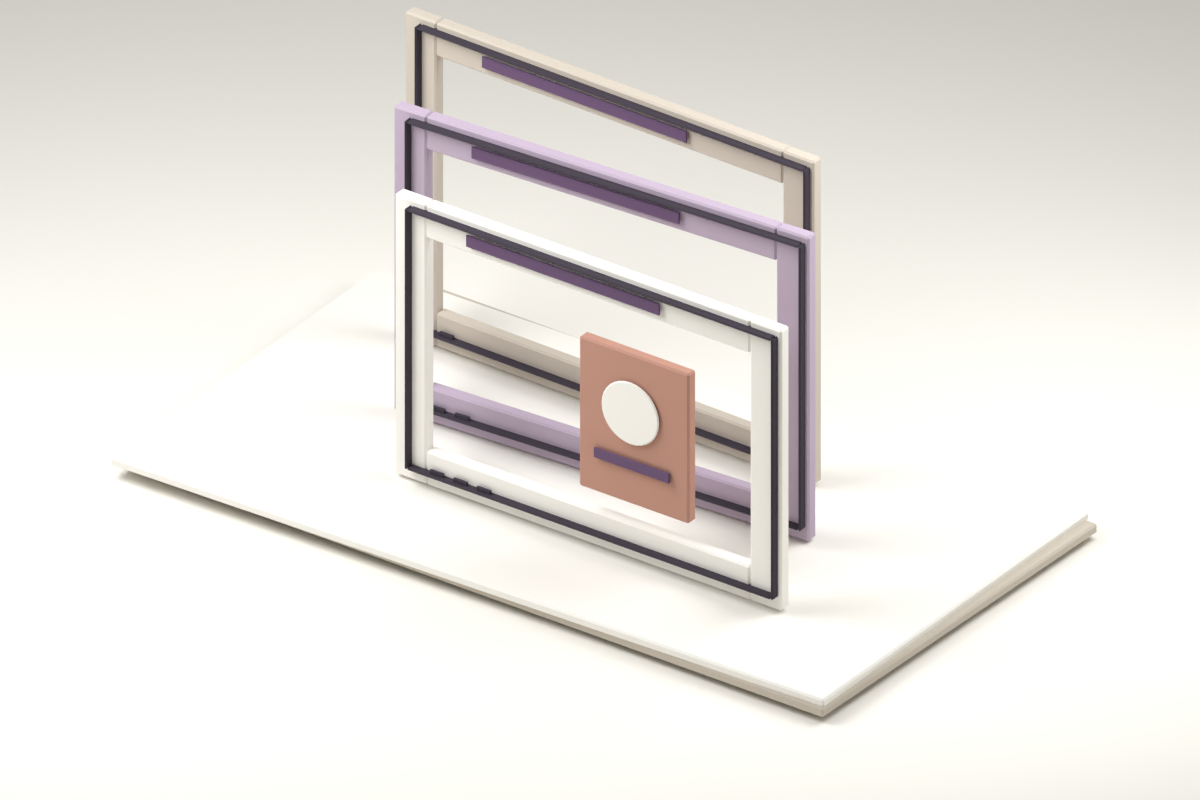
Three offset paper portals and a small abstract catalog-image tile on a paper base.
Delivery, in layers. Three paper layers stand for the document, startup delivery and catalog image. This is a conceptual study—not a verified dependency graph. Depth and spacing are not timing measurements.Back to front: document · startup delivery · catalog image
The parser-initiated delivery chain

In mobile 04, 45 script requests completed 3.33 MB before DOMContentLoaded at 8.006 s. The three large assets below were parser-initiated. Their rendered script elements later showed neither async nor defer.

Selected script deliveries · representative mobile run
Public assetEncoded bytesStart → finish
lib-react-d8eb…792,849 B0.456 → 7.728 s
6784-prod-01c6…446,890 B0.455 → 7.033 s
output.9408…329,726 B0.455 → 6.508 s

These are strong leads for a delivery experiment, not a proven module graph. Bundle names do not identify the expensive package; rendered attributes do not reconstruct every original parser dependency. The LCP image’s initial request priority was Low in all ten runs. Priority changes were not analyzed, so no final-priority claim is made.

Request evidence · Rendered script attributes.

What happens when CPU and network settings change?

Three additional 15-second checks keep the mobile viewport, user agent and DPR constant. They vary CPU slowdown and network shaping. Each alternative setting has one observation and is not pooled with the five-run baseline.

Mobile sensitivity checks · same viewport; unmatched live content
CPU / networkn / windowLCP
4× / shaped 4G5 / ~30 s9.240 s median
1× / shaped 4G1 / ~15 s9.280 s
4× / native network1 / ~15 s1.844 s
1× / native network1 / ~15 s0.764 s

Removing CPU slowdown while retaining 4G did not remove the long LCP. Native network shortened it substantially even with 4× CPU slowdown. This directionally supports investigating the delivery envelope; it is not a measured optimization, a causal effect estimate or a forecast of real-user gains.

Proposed test

Identify which parser-delivered code and data are required for the first catalog viewport. Test earlier content/image discovery and smaller startup delivery without changing the legal flow, content, navigation or interaction behavior.
The desktop page moves even when it paints quickly.

Desktop’s score is tightly grouped at 0.720–0.732. The dominant repeated shift contributes 0.612: a viewport-wide DIV moves from x=0 to x=64 while nearby list-item rectangles collapse. Later right-rail and grid movement adds to the session.

On mobile, a DIV moves from y=64 to y=128 and the BODY moves from y=0 to y=86 during late startup. These repeated signatures identify affected structures, not the CSS rule or component that initiated the change.

Proposed test

Correlate the shift timestamps with source-mapped layout work, then reserve stable space for the actual late-arriving header, sidebar or other interface element. Do not assume the fix is missing thumbnail dimensions.

Early structural aliases and before/after rectangles are retained in desktop 03 and mobile 04. Aliases reset each run. These are bounded top-document shift-session scores, not full-lifetime field CLS. CLS investigation guidance.

Illustrated reading note / stability

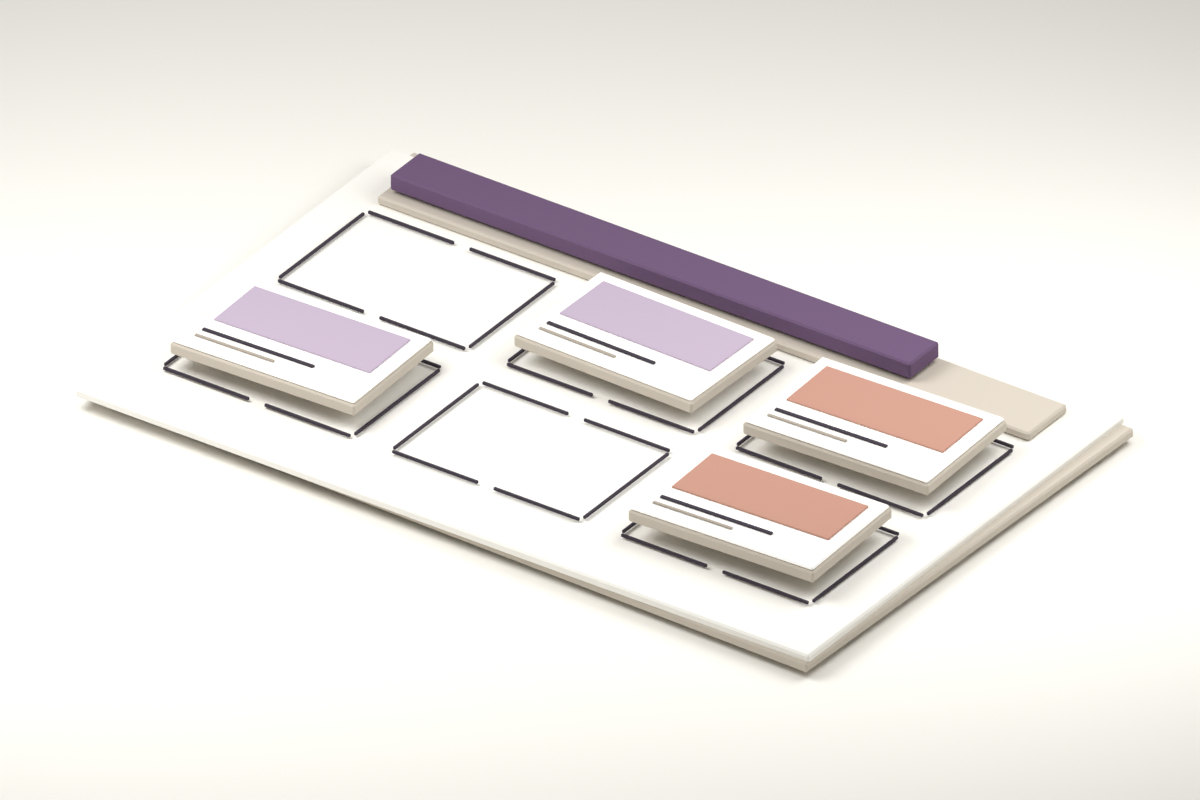
A paper layout with six outlined slots, four raised content tiles and two deliberately empty slots.
Space before content. Outlined slots make reserved space visible before content arrives. This illustrates a proposed investigation—not production geometry, a shift replay or an implemented fix.Outlines: reserved space · raised sheets: illustrative content

Broad delivery is a lead, not proof of waste.

The accepted page starts a median 272 HTTP requests on desktop and 222 on mobile. Scripts account for about 3.50 MiB and 3.43 MiB respectively. A large DOM and many requests justify an ownership investigation, but do not tell us which work is unnecessary.

Landing HTTP activity · medians, n=5 per profile
MeasureDesktopMobile 4G
Request starts272222
Completed encoded bytes5.76 MiB4.90 MiB
Script starts / bytes58 / 3.50 MiB50 / 3.43 MiB
Image starts185147
DOM elements / catalog cards5,822 / 1195,147 / 118
Landing measurements and timing distributions
Landing measurements · observed times after navigation
Profile / evidenceFCPLCPShift scoreCatalog anchor
Desktop · landing-01232 ms1.032 s0.7320.971 s
Desktop · landing-02236 ms0.836 s0.7200.801 s
Desktop · landing-03224 ms1.056 s0.7201.000 s
Desktop · landing-05276 ms1.016 s0.7200.958 s
Desktop · landing-06276 ms0.932 s0.7200.844 s
Mobile 4G · landing-01732 ms9.216 s0.1788.866 s
Mobile 4G · landing-02744 ms9.244 s0.1788.859 s
Mobile 4G · landing-03640 ms9.896 s0.1789.413 s
Mobile 4G · landing-04804 ms9.240 s0.1788.811 s
Mobile 4G · landing-05704 ms9.076 s0.1788.715 s

“Catalog anchor” is the first 50 ms-polled geometry match for a catalog link. It is not click readiness, accessible interaction readiness or proof that every card has loaded.

Descriptive distributions · nearest-rank p50 / p75
MeasurenMinimumMedianp75Maximum
Desktop · FCP5224 ms236 ms276 ms276 ms
Desktop · LCP50.836 s1.016 s1.032 s1.056 s
Desktop · Shift score50.7200.7200.7200.732
Desktop · Document response start5118 ms143 ms177 ms179 ms
Desktop · DOMContentLoaded50.435 s0.468 s0.556 s0.591 s
Mobile 4G · FCP5640 ms732 ms744 ms804 ms
Mobile 4G · LCP59.076 s9.240 s9.244 s9.896 s
Mobile 4G · Shift score50.1780.1780.1780.178
Mobile 4G · Document response start5133 ms169 ms246 ms278 ms
Mobile 4G · DOMContentLoaded57.860 s7.955 s7.964 s8.006 s
Gate state, cache state and network accounting

These are accepted-session loads with cookies/storage retained. They do not measure a brand-new user’s legal acceptance, challenge, consent or authentication path.

HTTP totals count request hops and completed encoded bytes within the recorded window. Pending/failed partial transfer is excluded. Raw capture totals also contain data/extension resources; the report filters those out. All cache-served entries in the raw landing captures were non-HTTP data resources. Cross-origin ResourceTiming transfer size of zero is not cache evidence.

Only the parent browser target is observed. Worker and out-of-process iframe traffic may be absent. Landing network counts have a small final-drain boundary gap. Room and diagnostic captures include a drain after the observation boundary. No native HAR, headers, response bodies or physical-wire byte total is claimed.

Initial-load layoutOptional · 2 device views

Desktop and mobile layout context for the loading and stability findings.

Device frames indicate layout profiles, not physical test hardware.

02 / Landing to room

One click.
Several clocks.

A changed URL is not a usable player. Route changes, enabled controls and a source-qualified video frame are measured independently, using touch on mobile and mouse on desktop.

BoundaryFive valid ordinary public-room journeys per profile, after roughly 12.5 seconds of accepted landing preparation. Live room selections vary.

First enabled player control
Desktop0.28 s
Mobile 4G0.45 s
First recognized visible/enabled control
First source-qualified frame
Desktop0.55 s
Mobile 4G1.78 s
Median callback · n=5 per profile
New completed HTTP bytes
Desktop12.39 MiB
Mobile 4G6.46 MiB
Excludes pre-click carry-in bytes

Mobile’s tail matters more than its route change.

The median mobile route change is observed at 94 ms. A recognized visible, enabled player control appears at 446 ms; the first source-qualified frame follows at 1.776 s. In the slowest valid run, those last two milestones stretch to 1.890 s and 3.478 s.

Desktop is more consistent in this small sample: controls at a 278 ms median and the first source-qualified frame at 548 ms. All five measured journeys per profile produced a qualified frame, but ten successful observations cannot establish production reliability.

Descriptive distributions · nearest-rank p50 / p75
MeasurenMinimumMedianp75Maximum
Desktop · Route observed535 ms37 ms39 ms43 ms
Desktop · Enabled control5267 ms278 ms287 ms290 ms
Desktop · Metadata observed5475 ms532 ms547 ms565 ms
Desktop · Qualified frame5491 ms548 ms560 ms584 ms
Mobile 4G · Route observed586 ms94 ms94 ms118 ms
Mobile 4G · Enabled control5431 ms446 ms449 ms1,890 ms
Mobile 4G · Metadata observed51,551 ms1,658 ms1,668 ms3,234 ms
Mobile 4G · Qualified frame51,596 ms1,776 ms1,784 ms3,478 ms

Illustrated reading note / readiness

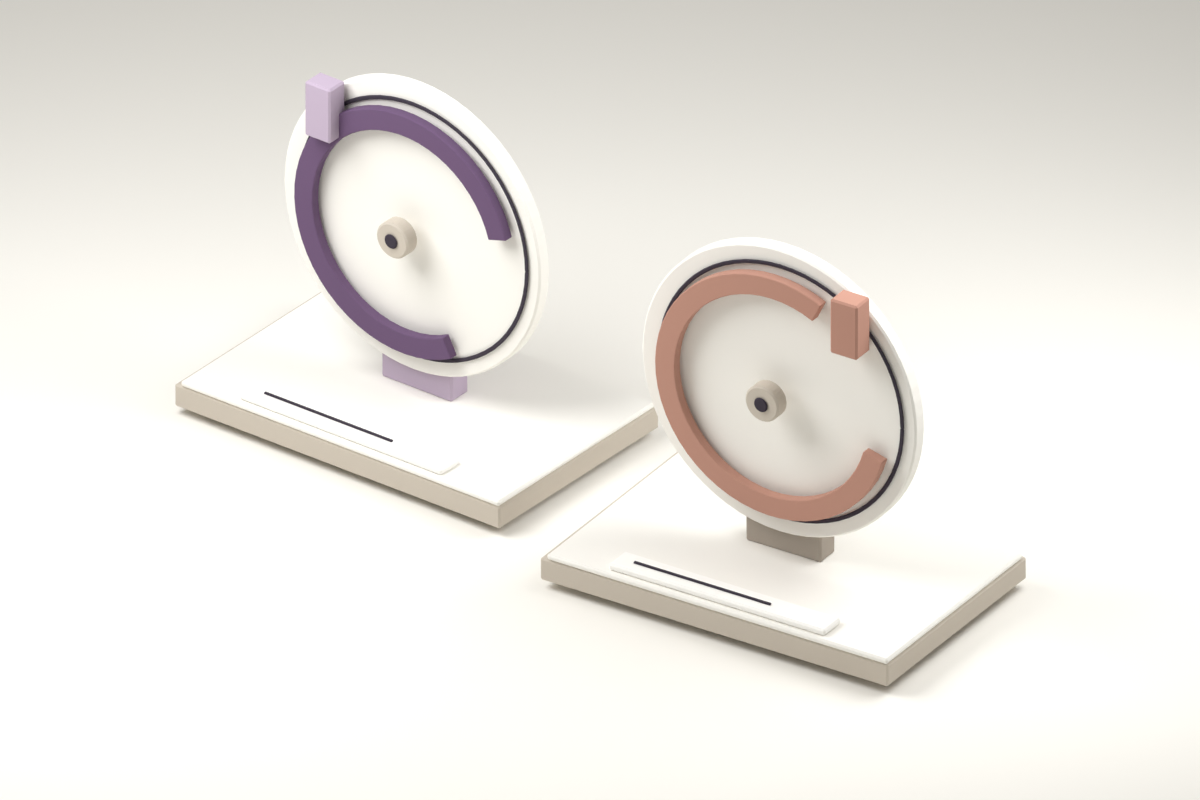
Two separate paper dials on individual stands, with plum and clay rims and no clock hands or numbers.
Two milestones, two observations. The left marker stands for visible, enabled controls; the right for the first source-qualified frame. These are conceptual markers—not synchronized clocks, progress indicators or a measured journey replay.Left: controls · right: qualified frame
All room journeys, including the slower mobile result
Room-entry measurements · observed times after trusted click
Profile / evidenceRouteControlQualified frameInput
Desktop · room-0335 ms0.290 s0.560 smouse
Desktop · room-0437 ms0.278 s0.584 smouse
Desktop · room-0537 ms0.267 s0.537 smouse
Desktop · room-0643 ms0.287 s0.491 smouse
Desktop · room-0739 ms0.269 s0.548 smouse
Mobile 4G · room-0286 ms0.431 s1.709 stouch
Mobile 4G · room-0394 ms0.443 s1.596 stouch
Mobile 4G · room-0494 ms0.449 s1.776 stouch
Mobile 4G · room-05118 ms1.890 s3.478 stouch
Mobile 4G · room-0691 ms0.446 s1.784 stouch

The slower mobile run remains included because its recorder and source qualification are valid. No performance-based outlier removal is applied.

How a frame and a control qualify

A frame requires a changed pathname, visible video geometry, and either a newly discovered video element or post-click media source/generation change. Every measured frame used an existing element with a changed source and generation 1. This prevents a landing preview’s old frame from counting as room startup.

Control readiness is the first visible, enabled button or button-role element with one of the documented player aria-labels. It does not verify every player operation or keyboard path. A 50 ms poll bounds these first observations; visibility checks do not establish occlusion-free viewing.

Frame callbacks concern frame submission/composition, not guaranteed physical display. A playing event may arrive after a frame callback, so the report does not force them into a false chronological sequence. Video-frame callback specification.

The query flag is absent from every room URL. Same-document time origin and modern-interface markers persist. That establishes continuity of the observed document, not server-side experiment assignment after navigation.

Much of the XHR traffic is playback.

Across the roughly 30-second room window, completed new-request bytes reach a median 12.39 MiB on desktop and 6.46 MiB on mobile. Video, audio and manifests account for most of that activity. Transport labeled XHR must not automatically be classified as application overhead.

New room HTTP activity · medians, n=5 per profile
MeasureDesktopMobile 4G
Starts within first 10 s110102
Completed bytes within first 10 s4.56 MiB2.16 MiB
Starts within ~30 s229221
Completed bytes within ~30 s12.39 MiB6.46 MiB

No new Script request appears in the measured room windows. That says code was already available, not that JavaScript stopped executing. Lower mobile media transfer can reflect throttling, rendition or changing content; it is not evidence that mobile is more efficient.

Hypothesis

A concrete contention hypothesis. The slow mobile journey overlaps 130 landing thumbnails that began 0.82–0.90 s before the click and finish as late as 1.84 s afterward. Peak in-flight requests reach 138. Controls and media startup are also delayed in that run. This is correlation in one valid observation—not proof that canceling thumbnails would produce a specific gain. Inspect mobile room 05.

Pre-click carry-ins and media-classified totals
Completed bytes · payload MIME, falling back to resource type; independent nonadditive medians
MeasureDesktopMobile 4G
Video11.30 MiB5.51 MiB
Audio0.59 MiB0.58 MiB
HLS manifests0.07 MiB0.07 MiB
Image0.29 MiB0.07 MiB
Script0.00 MiB0.00 MiB
Other XHR0.05 MiB0.05 MiB
Other Fetch0.08 MiB0.08 MiB

One mobile journey has 134 carry-in requests and about 1.16 MB of whole-hop carry-in completion. Those bytes can include transfer before the click; they are not additional click-window bytes. Separate ongoing landing work from new room work before deciding what to cancel.

Every included room capture has zero post-click and zero unknown-time orphan events. Remaining orphan events are explicitly before the click. Three recordings without that classification are excluded from the reported sample.

Proposed test

Trace the slow mobile journey from intent to enabled controls and source-qualified frame. Attribute overlapping requests to a lifecycle owner before canceling stale work; preserve intentional shared state and back-navigation behavior.

Room-entry layoutOptional · 2 device views

Desktop and mobile layout context for control readiness, the first qualified frame and overlapping network activity.

These are device layouts, not successive moments in a measured transition.

03 / Cross-cutting decisions

Choose the intervention
after the evidence.

Field context, code ownership and server cost answer different questions. Choose architecture changes by measured cost and controlled experiments, not by a predetermined rewrite.

The field and the lab are measuring different populations.

Google CrUX’s normalized homepage data reports phone p75 LCP of 3.538 s and INP of 462 ms. The desktop values are 3.271 s and 221 ms. These field results do not isolate the feature-flag interface or the lab test conditions.

Google CrUX field p75 · 2–29 August 2026
Scope / form factorLCPINPCLSTTFB
Homepage / Phone3.538 s462 ms0.020949 ms
Homepage / Desktop3.271 s221 ms0.080825 ms
Origin / Phone3.612 s376 ms0.040845 ms
Origin / Desktop2.584 s150 ms0.360729 ms

Retained CrUX Vis reading on 4 September 2026, covering 2–29 August. Snapshot values, dashboard links and retrieval record. Dashboard links advance over time.

CrUX strips query parameters, aggregates eligible Chrome experiences and attributes same-document route activity to the initial page view. The homepage’s INP and CLS can therefore include later room activity. Network, hardware, consent, legal state, build and experiment assignment are unmatched. CrUX methodology.

Independent synthetic benchmarks

No matching public Catchpoint/WebPageTest result or exact-flag PSI lab report was retrieved. Public WebPageTest history searches over 30 days and one year returned no matching rows. This does not exclude private, unlisted, inaccessible or expired tests. No hosted or paid test was submitted.

PSI field data would reuse CrUX rather than independently replicate it. No URL-specific HTTP Archive numeric record was retrieved. PSI methodology · Catchpoint public-share documentation.

React is observed. The package-level culprit is not.

Production exposes React-owned DOM and public React/React DOM markers. That confirms a React footprint, not a React rendering bottleneck. TanStack, react-bootstrap and deployed React Server Components remain unverified in production.

React initialization (“bootstrap”) is distinct from the react-bootstrap component library. Prove that the library ships, executes and contributes material cost before proposing to replace its controls.

Boundary

Verify the production dependency graph. Source-mapped build and runtime evidence are needed to establish whether TanStack or any other suspected package ships, executes and contributes material cost. Minified substring searches cannot prove a package is absent.

What the CPU samples show
Phase-clipped CPU samples · one independent diagnostic per profile and phase
Profile / sampled intervalCovered timeIdle shareLeading gap
Desktop / navigation → LCP1.360 s18.2%208 ms
Desktop / click → frame + 1 s1.631 s76.6%0 ms
Mobile 4G / navigation → LCP8.946 s75.4%422 ms
Mobile 4G / click → frame + 1 s2.608 s52.8%0 ms

These are independent, phase-clipped diagnostics—not timing samples. The covered mobile pre-LCP interval is 75.4% sampled idle; desktop’s shorter startup interval is only 18.2% idle. The first 208 ms desktop / 422 ms mobile after navigation are not covered. Non-idle includes browser engine work, not just JavaScript.

Room samples are clipped from the trusted click through one second after the diagnostic frame, removing pre-click profiler overhead. Full profiles and URL-level buckets remain available, but their whole-window idle shares are not startup occupancy. Clipping method, intervals and source buckets.

URL-level leaf time is not a React commit duration, package owner or critical-path delay. Browser engine categories and unattributed work are not reassigned to React. End-only landing counters are not presented as measured CPU deltas.

Obtain matching build graphs and source maps, then correlate narrow navigation-to-LCP and click-to-frame traces with component commits. The public source-map lookup returned 404; private maps and a profiling build were not available. Public script-marker checks are limited substring evidence, not a dependency inventory.

Would RSC, Qwik or Partytown improve this?

React Server Components: a narrow delivery experiment

RSC can keep selected component work and code out of the client, but interactive client boundaries remain. Test a read-heavy slice, measuring client bytes/execution, HTML or Flight transfer, streamed readiness, server CPU/memory, TTFB and caching. Server-rendered HTML or createRoot alone does not establish deployed RSC. React’s RSC documentation.

Qwik: compare resumability with a fair baseline

Resumability changes startup work, but a rewrite also changes routing, chunking, prefetch, serialization and server execution. Compare it with an optimized React baseline using equivalent content, legal flow, player behavior, focus, state and cache conditions. No Qwik arm was measured here. Qwik’s resumability model.

Partytown: only for an eligible measured owner

Delete or defer unnecessary third-party work first. A worker can change DOM/event behavior, cookie access, CSP/CORS needs and request semantics. Local worker-message requests are not external HTTP transfers. Do not move legal logic, security challenges, app bootstrap, navigation, media or account flows merely because a sampled URL looks costly. Validate one noncritical script, event parity and rollback. Partytown’s documented trade-offs.

Server CPU, cost and the experiment decision

Browser TTFB mixes client, network, connection, edge, cache and origin time. It cannot establish origin CPU or cost. RSC, SSR and server-side loaders may move rather than remove work.

A fair architecture test needs source-aligned server spans, CPU/memory, response bytes, cache-key correctness, cold/warm paths and errors, in an authorized test environment. None of those private origin measurements or a load test was obtained. Reject an apparent client win if it causes unacceptable server, accessibility or reliability regressions.

A useful sequence of work.

FIRST / DELIVERY

Trace and reduce the startup chain.

Identify required parser-delivered code, expose first-viewport content earlier, and repeat both profiles. Accept only a reproducible LCP/readiness gain without changing the experience being measured.

SECOND / GEOMETRY

Reserve the space that actually moves.

Connect the repeated shift signatures to their triggering layout dependency. Verify the fix across initial load, responsive widths and late-arriving interface states.

THIRD / ROOM ENTRY

Explain the valid mobile tail.

Measure controls and source-qualified frames separately. Attribute carry-ins and post-click work before canceling anything; preserve playback, back navigation and focus behavior.

THEN / ARCHITECTURE

Test one proven owner.

Compare one surgical delivery, RSC, worker or resumability intervention against an optimized baseline. Define a meaningful effect size above observed run variation and include server cost.

These are proposed experiments, not implemented fixes or measured wins. Field aspirations such as LCP ≤2.5 s, INP ≤200 ms and CLS ≤0.1 apply to real-user p75 evaluation, not retroactive pass/fail grades for this small lab sample. Core Web Vitals definitions.

Test conditions and measurement limits.

Chrome measurements cover the production feature-flag URL on desktop and emulated mobile. The legal gate was already accepted; no account, chat, tipping or payment actions were tested. The findings therefore describe accepted-session browsing, not a new user’s first visit.

Controlled settings and shared measurement boundaries
MeasureDesktopMobile 4G
Viewport / DPR1440 × 900 / 1390 × 844 / 3
CPU slowdown1× host CPU4× host-relative slowdown
NetworkNative network150 ms latency; 500,000 B/s down; 125,000 B/s up
Cache / service workerCache disabled / SW bypassCache disabled / SW bypass
Room inputTrusted mouseTrusted touch
State / observationAccepted session; ~30 sAccepted session; ~30 s
Coverage, exclusions and privacy

The analysis includes twenty valid observations, four separate CPU diagnostics and three sensitivity checks. One 58.6-second desktop landing recording is excluded for its long window; three room recordings are excluded because their orphan network events lacked phase classification. Their timing observations are not described as playback failures.

Landing observation windows span 30.315–30.607 seconds; room windows are approximately 30.55–30.63 seconds. Observers were installed before every recorded FCP and report no drops or resource-buffer overflows. Installation still follows a new-document poll, not document-start injection; absence of recorded drops is not a completeness guarantee. Performance Timeline buffering rules.

Network coverage is parent-target only. Encoded completion bytes omit unfinished partial transfer. The legacy CDP network-shaping command is recorded and deprecated; CPU slowdown is host-relative and uncalibrated. Live content, one host, retained storage, browser extensions and observer overhead remain part of the environment.

No performer images, media payloads, descriptions, chat, account data, headers, cookies, response bodies, incidental request query strings or function names are saved. The target URL, public script basenames and sanitized geometry are retained for attribution.

Experiment assignment, private build graphs/maps, source-aligned component traces, physical-device replication, origin CPU and matched outside synthetic results remain unresolved. These are explicit limits, not completed tests.

Which tools support which claims?

Measurements and per-run evidence · Supporting-file integrity manifest.

  • Chrome Network events: request starts, outcomes and completed encoded bytes; parent target only.
  • PerformanceObserver: paint, layout shifts and tasks; bounded observer coverage.
  • Video-frame callbacks: source-qualified frame observations; not physical display.
  • CPU profiler: sampled execution, clipped to stated intervals; not package attribution.
  • CrUX: field context; query variants and same-document journeys aggregated.
  • Integrity hashes: file consistency; not experimental causality.

Units: MB means 1,000,000 bytes; MiB means 1,048,576 bytes.

The offline summary script filters HTTP(S), preserves missing values and computes nearest-rank p50/p75. Every five-run p75 is simply the fourth ordered observation, not a field percentile. Hashes establish file consistency, not causal correctness.

Glossary · definitions and measurement boundaries

Largest Contentful Paint

When the largest eligible image or text block in the viewport is painted.

Here it is a catalog image—not proof that the whole page or its controls are ready.

Median

The middle observation after sorting the results. With five runs, it is the third result.

It describes this small sample; it is neither an average nor a reliability guarantee.

Retained top-document shift score

A bounded measure of unexpected layout movement in the observed main document.

This report captures roughly 30 seconds. The result is not a full-visit field CLS measurement and may omit iframe movement.

Source-qualified frame

A video-frame observation tied to the newly entered room’s media source, so an old landing preview cannot count as room startup.

It does not guarantee physical display or complete player usability.

Resource span

The recorded interval from the image resource’s start to completion. It includes waiting as well as loading.

Cross-origin timing restrictions prevent separating every network phase here.

DOMContentLoaded

The browser event after HTML parsing and relevant deferred scripts complete. It does not wait for every image or guarantee a useful, interactive page.

Here it helps locate the script-delivery interval.

CPU slowdown

Chrome artificially slows execution relative to the test computer.

“4×” is a test setting, not a calibrated model of a particular phone. Changing it alone does not reproduce real-device behavior.

Completed encoded bytes

Bytes Chrome reports for requests that completed within the observed window. Incomplete transfers are excluded.

These totals are not a physical-wire measurement or a direct measure of unnecessary work.

First Contentful Paint

When the first eligible content, such as text or an image, is painted.

An early FCP can coexist with a much later catalog image. First content is not the same as useful completion.

Carry-in requests

Requests that began before the room-entry click and continued into the measured journey.

Their whole-request completion bytes may include earlier transfer, so they are kept separate from new post-click work.

Chrome User Experience Report

Aggregated measurements from eligible real Chrome experiences.

Its homepage data combines visits and removes query parameters, so it cannot isolate this report’s feature-flag variant.

75th percentile

A value at or below which approximately 75% of observations fall.

In this report’s five-run tables, nearest-rank p75 is simply the fourth sorted result—not a reliable estimate of a population’s 75th percentile.

Interaction to Next Paint

How long a qualifying interaction waits for the next visual update, summarized across a visit.

The CrUX values may include later room interactions, not just homepage startup.

Time to First Byte

Time until the document response begins. It combines client, connection, network, edge/cache and server influences.

It cannot by itself reveal origin CPU usage or server cost.